With the amount of data generated, it is vital that businesses grasp meaningful insight from data and analytics – but what key areas should be focused on for best results, and how could this enhance the backbone of your company, the supply chain.
For many years organizations have used technology to drive tactical information to manage the Workforce. However not been able to capitalize on the huge amount of data which can be converted into actionable insights. The rise of information and increase of millennial Workforce and wave of digital trans-formation has increased the need for ‘Workforce Analytics.’
According to Peter Sondergaard, Vice President of Gartner, “Information is the fuel of the 21st century, and data analytics the combus-tion engine.”Organizations today, face many challenges related to workforce, right from hiring, training, rewarding retaining along with old traditional systems, to consolidated global reporting across geo’s, and self-service reporting, etc. To overcome these common issues, the primary goal of any successful Organization should be “to place a right people for a right position at the right time” says Lily Mok, research director for Gartner EXP’s. Analytics is the best tool to achieve this goal. These advanced set of data analytics tools and metrics will analyze patterns and causal relations based on performance and improvement of the organization and individual. Analyze recruitment, staffing, L&D, fills, cost per hire, accession rate, retention rate, add rate, replacement rate, time to start and offer acceptance rate, compensation, etc. And then build a predictive model that can be used by the Human Resource team to improve employee performance and get a good return on the investment.

Information is the fuel of the 21st century, and data analytics the combustion engine. ”
PETER SONDERGAARD VICE PRESIDENT OF GARTNER
Two key components of HR Analytics:
- The Necessity arises from the need to have a core human management team with current industry expertise. Earlier the concentration on “intangible assets” did not even amount to 50 percent of the value creation and today it is almost 65 percent.
- An opportunity is when there is readily available data available virtually that can give information about the management and the development of the people. With the brains of Analytics, these data that can give some powerful assistance by transforming them into some valu-able, actionable insights and intelligence.
STEPS IN HR ANALYTICS:
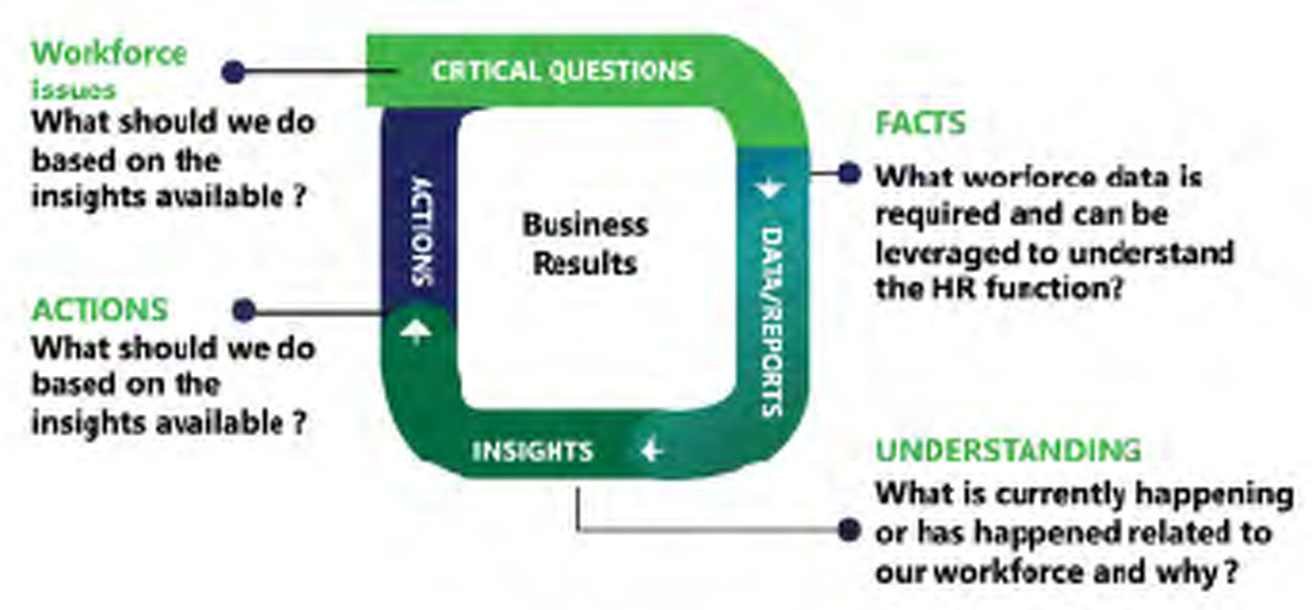
While HR is striving to be a strategic function focusing on HR analytics, Deloitte devised analytics models to assess various programs, using workforce analytics to assess leadership orientation, change inclination, training needs analysis etc. As Deloitte’s Global Human Capital Trends 2016 report notes, “77 percent of execu-tives now rate people analytics as a key priority … In response, companies are building people analytics teams, rapidly replacing legacy systems, and combining separate analytics groups within HR into one strategic function.” The same report found that 44 percent of surveyed companies use workforce data to predict business performance.They also use benchmarking to measure both efficiency and effectiveness of these programs. They recommend a four-step “issue/facts/understanding/actions” process, emulating basic methodology by leveraging analytics both classify the opportunities or issues and evaluate the impact of actions taken.
- Start with workforce issue at hand: Whether dealing with engagement or retention, identify the issue and then check if you have the information needed to measure.
- Understand the data or Information required to measure: It is important to look at two aspects:
- Review the data: With the huge amount of structured and unstructured data exists in various geo’s, you may need to identify what data your organization has and who is using it.
- Ask the right questions-It means what you want to tell larger audience using this data, it depends on strategic goals of the organization and what are the priorities of the business.
- Look for insights from data and reports and turn into meaningful actions. The data or reports used may be useful, but it will be impactful when analyzed properly.
- Examples: If the time of hire for niche skill has gone up from 60days to 90days, what does that mean, what actions do you need to take?

HR ANALYTICS FRAMEWORK:
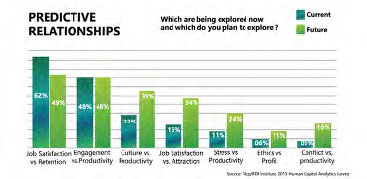
HR&OD experts identify the data sources. Then the HR data model is defined through data integration and normalization. The data is then stored, from the data storage, HR&OD experts identify the objectives. After which, the analytics experts formalize them using data mining, sta-tistics, machine learning, etc., then they interpret results and report to the executives then accord-ing to the result executive team allows them to do the required changes in the organization. From the above figure, we can see that after implementing HR Analytics significant jumps in relationships such as job satisfaction vs. customer satisfaction; job satisfaction vs. attraction; stress vs. productivity; and conflict vs. Productivity. These Analytics help the organization to be healthy and wealthy as well. Starting from Hire to Retire i
n the spectrum of variables could be measured to check the health of the organization.
- Recruitment: Net Hire Ratio, Cost per Hire, Source Mix, New Hire Rate through Internal/External, Rehire Rate, Interview/Offer Ratio etc., Average Sign on Bonus Ratio could be measured
- Internal: Promotion Speed Ratio at Various levels and bands, IJP Ratio, Cross – Function Mobility could be measured.
- Retention: Vol/Invol Attrition YTD (Year to Date), MTD (Month to Date) through Perfor-mance Bands, Levels could be measured.
- Performance Management: Average Performance Rating, Participation Rate, Rating distribution etc could be measured.
- Training: Training per HR, per FTE (Full Time Equivalent), expense per employee, quality could be measured.
- Compensation & Benefits: Comp Cost per FTE, Overtime Rate, Bonus Rate, Average Cost Rate for Contractors, Benefits exp per FTE, ESOP (Employee Stock Ownership Plan) could be measured.
- Workforce: Average Workforce Headcount, Age, Span of control, Geo& location split are measured.
But there are few common mistakes which one should avoid during driving and exploring the HR Analytics. They are:
- Keeping a data live even when it has no clear business reason for it. When the data does not have any important objective or specific business goal, keeping it alive is a common mistake. These data should be deleted from the data storage.
- Assessing workforce only on simple measures such as grades and test scores often fail to accurately predict the success. One should give the employee a hypothetical condition or give him a challenging job and judge the success based on the efficiency and accuracy. After which you can analyze whether he/she fits right into the role or not.
- Develop a culture of data-driven decision-making.
- Empower line managers to decide on this, not just HR and L&D.

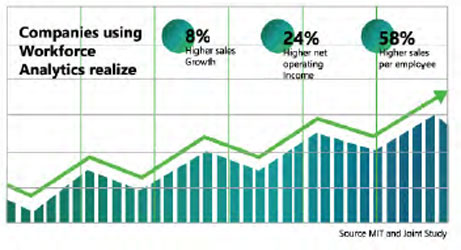
There’s no doubt with HR Analytics that any organization which can attract the right compe-tencies, manage talent effectively, utilize capacity efficiently, and retain people and set itself up for long-term success. According to the above statistics surveyed by MIT and IBM, Multinational companies using HR Analytics can witness 8% higher sales growth, 24% higher net operating income and 58% higher sales per employee. Which, proves the impor-tance of HR Analytics tool today.


